Allegro Packets addresses possible performance limitations, like how to measure and quantify them, how to show their impact, and suggest meaningful explanations and ways to correct them. It's about identifying potential performance issues, solving them faster and more accurately, while working more effectively with users and application owners. Gaining full network visibility at the packet level is an essential requirement to carry out analysis and measurement.
We assume that the client-to-server communication via request/reply mechanism is based on the TCP/IP transport protocol. This procedure is used in nearly all interactive business applications. These include web-based applications, fat client applications, file server accesses, file transfers, backups, etc. Since only the TCP/IP protocol is considered, this excludes voice and video applications. These use other transport mechanisms.
For each operation, there is at least one request and one response at the application layer. These are called Application Layer Protocol Data Units (PDUs). A simple client-server interaction looks like this: At the application layer, a request message is passed to the client TCP stack (TCP socket) for segmentation (into packets), addressing and transmission. The functions provided by the TCP stack are usually completely transparent to the application layer.
At the receiving end of the connection (the server), the application data is extracted from the packets transmitted over the network and reassembled as application layer messages and delivered to the associated service for processing.
Once application layer internal processing is completed, the server forwards the response to the server's TCP stack. The message text is segmented and transmitted to the client over the network. The performance of this request/reply exchange of information is determined by two factors:
Therefore, both areas should be considered separately in a performance analysis. The information reassembled after transmission represents the network-centric view of the application, while the packets collected by the Allegro Network Multimeter in a recorded pcap file inform us how efficiently the network is transporting the messages.
To analyze application performance and operational performance in particular, it is only necessary to examine the factors that affect the transmission of the operational request and the resulting response. The difference lies in the processing times of the clients and servers and the delays occurring on the transmission medium. If the flow chart is extended, the total delay is divided into the following four categories:
The measurement of the server's processing delay begins at the time when the server received the last packet of the client request. This packet also represents the end of the request message. The server's processing delay ends with the first packet of the response. This packet also represents the beginning of the reply message.
The measurement of the transmission delay starts with the first packet transmitted by the server in response to a previously received request and ends with the last packet of the reply sequence. This group of packets represents the entire message transported over the network.
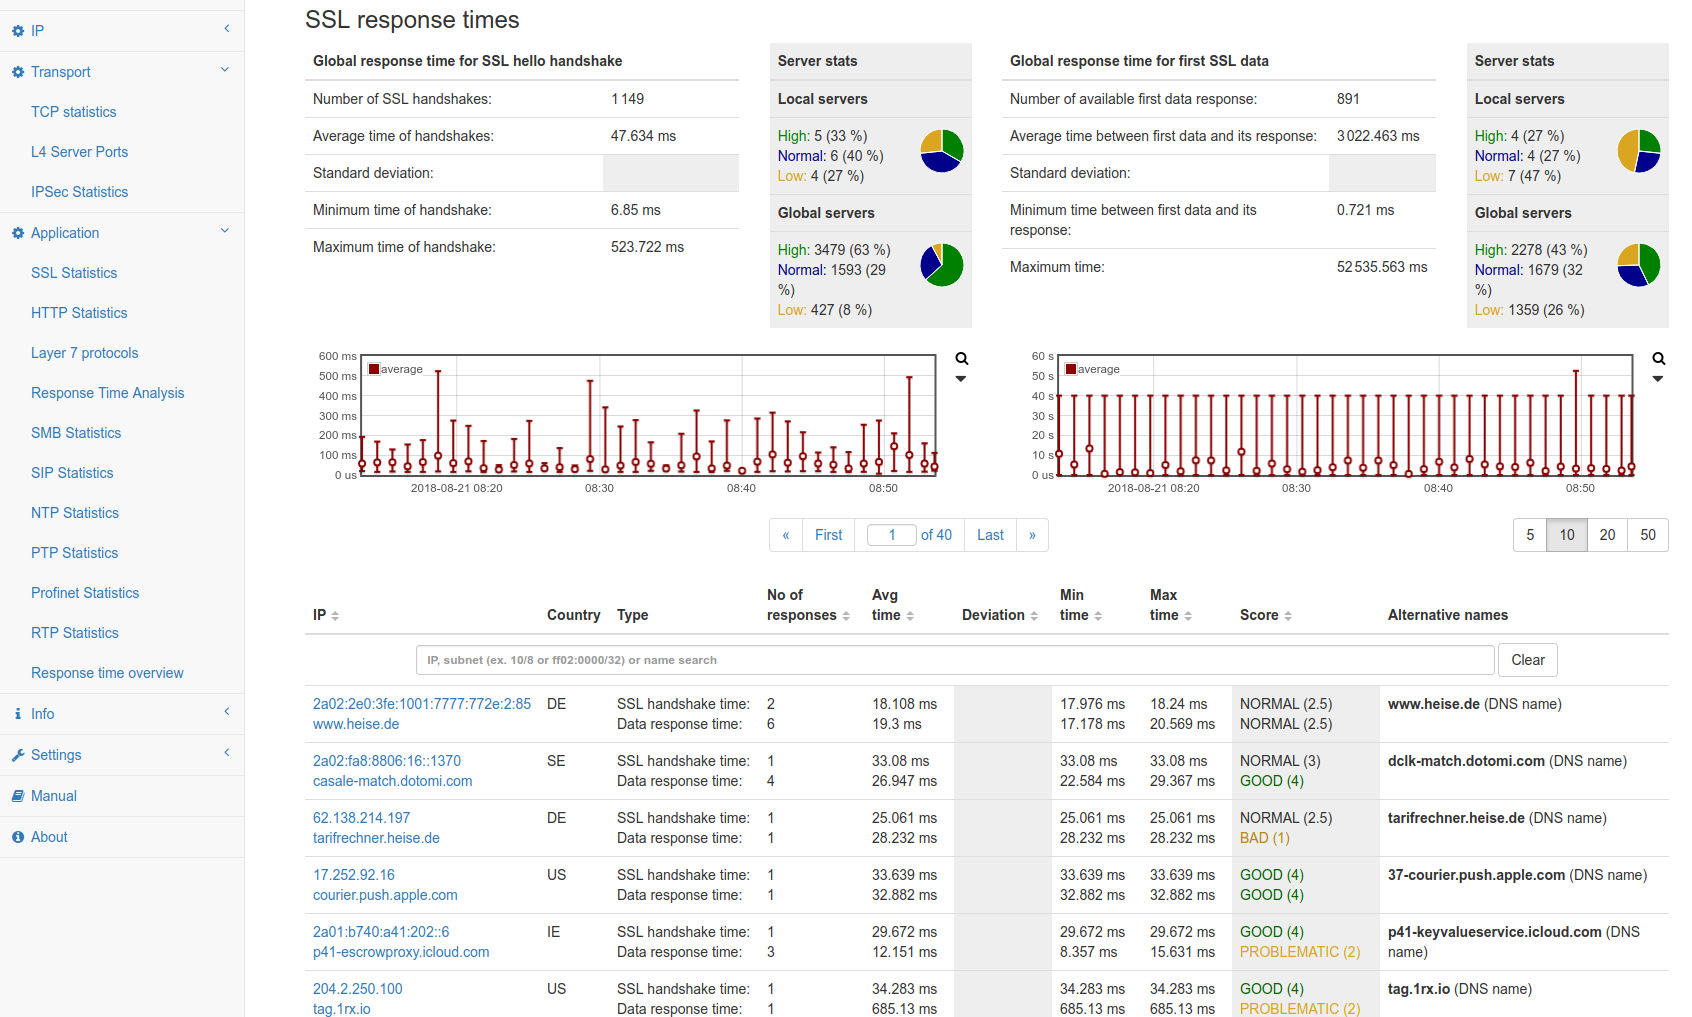
The Allegro Network Multimeter displays application layer response times for SSL traffic. In the figure above, on the left hand side, the times for building the encryption are shown. On the right hand side, the duration of the response to an encrypted request (time between the first client packet and the first server response packet) is visualized.
The described measurements enter into a performance analysis framework. This framework describes nine potential performance bottlenecks between the clients, the network and the servers. Therefore, each application performance assessment should analyze all twelve problem areas:
By receiving packet level data from Garland Technology at the application layer, the majority of information is transmitted in more than one data packet. The information segment size is typically larger than the maximum segment size MSS or payload size that can be transmitted by a network packet, which is typically 1460 bytes for Ethernet. The packets assigned to a request or the resulting response can be described as one data flow. The combined payload of all data packets of a data flow represents the messages transmitted at the application layer.
In order to drive the high performance diagnostic appliances like the Allegro Network Multimeter, Garland Technology helps to provide packet level data carried across the network. Since the packet is the most granular measure needed for network administrators to gain complete visibility of the network traffic, the Allegro Network Multimeter relies on Garland’s visibility solution to deliver the full spectrum of data. This allows for a highly efficient solution to evaluate and measure traffic up to 100G without delay.
For more information visit the Garland Technology and Allegro Packets joint solution. Looking to add visibility to your industrial environment, but not sure where to start? Join us for a brief network Design-IT consultation or demo. No obligation - it’s what we love to do.